How Much Money Is There in the World? — The $600 Trillion Big Picture [2026 Edition]
The money in your bank account. The stocks in your portfolio. The house you live in. The roads you drive on every day.
All of these are part of “the world’s money.” So what happens when you add up every asset and every dollar on the planet?
The answer is roughly $600 trillion. That’s the estimate McKinsey Global Institute published in 2025 — the combined net worth of every household, corporation, and government on Earth, after subtracting all debt.
This article breaks down the structure of global money and assets from six different angles. Because each angle overlaps with the others, you cannot simply add them together. Real estate alone is ≈$393T, global debt exceeds ≈$348T, and the notional value of derivatives tops ≈$846T — numbers far larger than $600T. These are different measurements of the same global economy, not separate piles of money. In the second half, we’ll turn this structural understanding into actionable investment thinking.
The Big Picture at a Glance
Here’s the world’s wealth organized by lens. The key point: these are different measurements of the same global economy — you cannot add them up.
| Lens | What It Measures | Scale |
|---|---|---|
| A. Money (Liquidity) | Money inside the banking system | M2: ≈$144T |
| B. Real Assets | Appraised value of physical things | ≈$540T |
| C. Financial Assets | Value of rights and claims | ≈$280–310T |
| D. Liabilities | Total debt | ≈$348T |
| E. Derivatives | Contracts layered on top of assets | Notional ≈$846T / Market value ≈$22T |
| F. Institutional Holders | Who owns what | Pensions ≈$55T, Insurance ≈$37T, etc. |
Let’s look at each one in detail.
Lens A: Money — How Much “Real Money” Exists?
Money comes in layers.
- M0 (≈$9T): “Base money” created by central banks. Physical currency plus reserves that commercial banks hold at the central bank. The concentrate from which all other money is derived.
- M1 (≈$65T): M0 plus demand deposits — money you can spend immediately. Your checking account balance lives here.
- M2 (≈$144T): M1 plus time deposits and other near-money that exists but isn’t instantly spendable. The broadest common definition of “money.”
M0 is the smallest, then M1, then M2. They nest like Russian dolls: M0 ⊂ M1 ⊂ M2.
Why does M0 multiply roughly 16× into M2? Fractional-reserve banking and credit creation.
Say you deposit $10,000 at a bank. The bank keeps $1,000 in reserve and lends $9,000 to someone else. That borrower spends the $9,000, and the recipient deposits it at their bank. That bank keeps $900 and lends out $8,100. And so on.
Only $10,000 of base money existed, yet total deposits grow: $10,000 + $9,000 + $8,100 … This is credit creation. Every time a bank lends, the money supply expands. The “seed money” of M0 that central banks create gets multiplied many times over through bank lending, becoming M2.
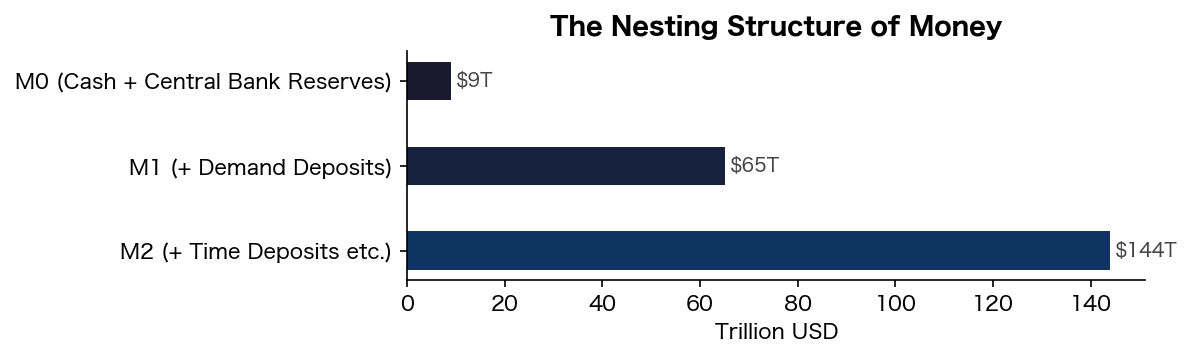
The ≈$9T of base money created by central banks has been multiplied roughly 16× through the banking system into ≈$144T.
Here’s a crucial fact. Textbooks teach that people deposit money in banks, and banks lend it out. In reality, it works the other way around.
As the Bank of England officially explained in 2014, banks create deposits the moment they make a loan — the money appears in the borrower’s account out of thin air. Lending creates deposits, not the other way around.
Source: Bank of England, “Money creation in the modern economy”, Quarterly Bulletin 2014 Q1
Lens B: Real Assets — The Value of Physical Things ≈$540T
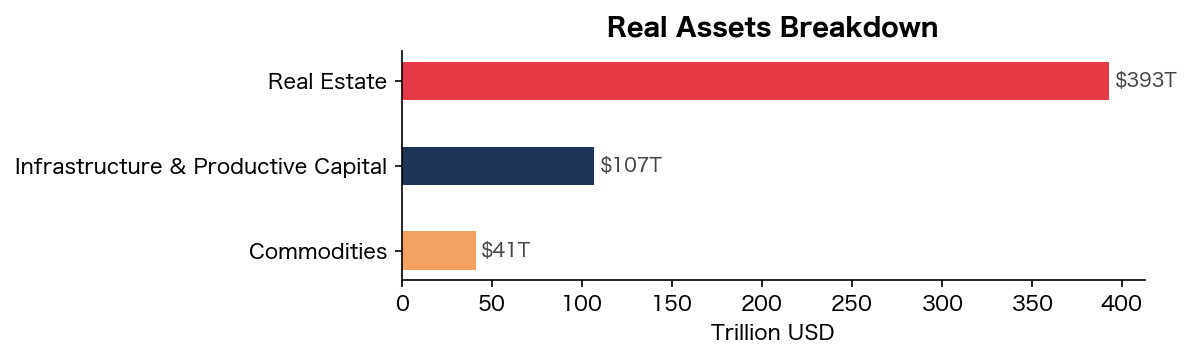
Real Estate: ≈$393T — The World’s Largest Asset Class
Roughly 4× global GDP.
| Category | Scale |
|---|---|
| Residential | ≈$310T+ |
| Commercial | ≈$58T |
| Agricultural land | ≈$25T |
Source: Savills “How much is global real estate worth?” (2025)
Infrastructure & Produced Capital: ≈$107T
McKinsey estimates total real assets at ≈$500T; subtracting ≈$393T of real estate leaves the rest. This includes roads, bridges, railways, power grids, water systems, factories, machinery, data centers, automobiles (approximately 1.5 billion worldwide), ships, and aircraft. McKinsey projects an additional ≈$106T in infrastructure investment will be needed by 2040.
Source: McKinsey Global Institute “Out of balance” (2025)
Commodities: ≈$41T
| Item | Scale |
|---|---|
| Gold (above-ground stock) | ≈$34–36T |
| Oil & gas (proven reserves) | ≈$3T |
| Silver | ≈$1.3T |
| Industrial metals | ≈$1T |
Gold hit an all-time high of $5,589/oz in January 2026 — more than 2.5× its ≈$2,000 level just two years earlier.
Source: World Gold Council, CBS News (2026/2)
Lens C: Financial Assets — The World of Rights and Claims
Financial assets aren’t physical things — they’re rights. A stock is an ownership claim on a company. A bond is a right to repayment.
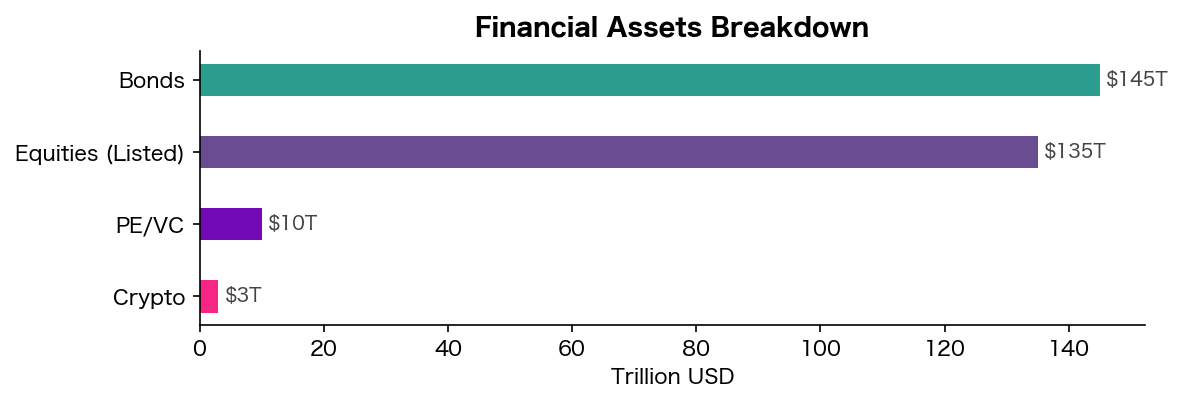
Equities (Public Markets): ≈$120–150T
| Market | Scale |
|---|---|
| United States | ≈$50T |
| Europe | ≈$13T |
| China | ≈$12T |
| Japan | ≈$6T |
| Rest of world | ≈$40–70T |
Important: A ≈$130T total market cap does not mean $130T in cash has flowed into the stock market. Market cap is calculated as “last traded price × shares outstanding.” If someone buys one share of Apple at $200, all approximately 15 billion shares get valued at $200, producing a ≈$3T market cap. But only $200 in cash actually changed hands.
Source: WFE via Mondovisione (2026/2)
Bonds: ≈$145T
| Category | Scale |
|---|---|
| Government bonds | ≈$80T |
| Corporate bonds | ≈$60T |
| Other (munis, MBS, etc.) | ≈$5T |
A bond is an asset to the holder and a liability to the issuer. That’s why bonds appear in both Lens C and Lens D — not double-counting, but two sides of the same coin.
Source: SIFMA Capital Markets Fact Book (2025)
PE/VC: ≈$10T; Crypto: ≈$3T
PE (private equity — buying private companies, improving them, and selling) accounts for ≈$6–7T; VC (venture capital — funding startups) for ≈$3–4T. Both invest in unlisted companies and are not included in the ≈$130T public equity market cap. Crypto breaks down into Bitcoin (≈$1.3T), Ethereum (≈$420B), stablecoins (≈$160B), and others.
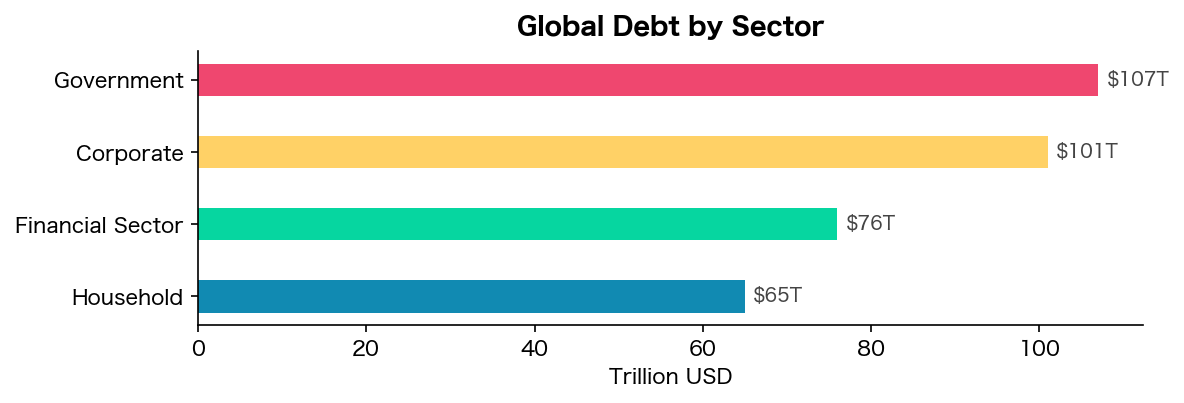
Lens D: Liabilities — One Person’s Asset Is Another’s Debt ≈$348T
According to the IIF (Institute of International Finance), total global debt hit a record ≈$348T at the end of 2025 — up ≈$29T year-over-year, the fastest pace since the pandemic.
By Sector
By Form
Not all of that ≈$348T takes the same shape.
| Form | Scale | Characteristics |
|---|---|---|
| Bonds (tradable debt) | ≈$145T | Government & corporate bonds. Investors can buy and sell them |
| Bank loans | ≈$100T+ | Mortgages, corporate loans. Not traded on markets |
| Private credit | ≈$2–3T | Direct lending by funds, bypassing banks. Growing rapidly (20%+ annually) |
| Other (leases, trade credit, etc.) | ≈$100T |
Private credit exploded in the 2020s — funds lending directly to companies instead of banks. Still only ≈$2–3T, but rapidly eating into traditional bank lending.
Source: IIF Global Debt Monitor (2026/2), IMF, SIFMA
Lens E: Derivatives — Contracts Layered on Top of Assets
A derivative is a contract whose value is linked to the price of something else. You don’t need to own the underlying asset.
Futures: “I agree to buy 1 kg of gold in three months at $70,000.” If gold rises to $80,000, you profit $10,000.
Options: You pay $5 for the right to buy Apple stock at $200. If the stock hits $250, you make $45. If it drops, you let the option expire and lose only the $5 premium.
Interest rate swaps (the largest market): Company A pays a fixed 3%; Company B pays a floating rate. On a $100M notional contract, only the interest-rate difference actually changes hands — the principal never moves.
That last point is the key to understanding derivative numbers. The ≈$846T notional value is the sum of all contract principals. But as the swap example shows, only the rate differential is exchanged — the principal itself doesn’t move. That’s why the actual risk exposure (market value) is only ≈$22T, a mere 2.6% of the notional amount.
| Type | Notional Value | Purpose |
|---|---|---|
| Interest rate | ≈$550T+ | Hedging interest-rate risk. Largest market |
| Foreign exchange | ≈$120T | Hedging currency risk |
| CDS (credit) | ≈$10T | Insurance against default |
| Equity | ≈$10T | Hedging/speculating on stock prices |
| Commodity | ≈$3T | Hedging oil, metals, etc. |
Source: BIS OTC derivatives statistics, end-June 2025
Lens F: Who Owns What — Institutional Investors
This lens looks at the assets from Lenses B and C from the perspective of who holds them. It’s not an independent asset category — it overlaps with the above.
| Institution | AUM | Primary Holdings |
|---|---|---|
| Pension funds | ≈$55T | Bonds 45%, Equities 35%, Alternatives 20% |
| Insurance companies | ≈$37T | Primarily bonds |
| Central bank balance sheets | ≈$28T | Government bonds, MBS, etc. Fluctuates with QE/QT |
| Sovereign wealth funds | ≈$13T | Norway ≈$1.6T, UAE ≈$1.5T, etc. |
| Foreign exchange reserves | ≈$12T | Primarily USD-denominated assets |
| Hedge funds | ≈$4.5T | High leverage |
| Total asset manager AUM | ≈$147T | McKinsey estimate (June 2025, all-time high) |
AUM (Assets Under Management) is the total value of assets that investment firms manage on behalf of clients. Companies like BlackRock and Vanguard pool money from pension funds and individual investors to invest in stocks and bonds.
The vast majority of global financial assets are held by these institutional investors. Direct retail holdings are only a fraction of the total. Pension funds alone manage ≈$55T, and their investment decisions move equity and bond markets significantly.
Source: McKinsey “Asset management 2025”, SWFI, IMF COFER
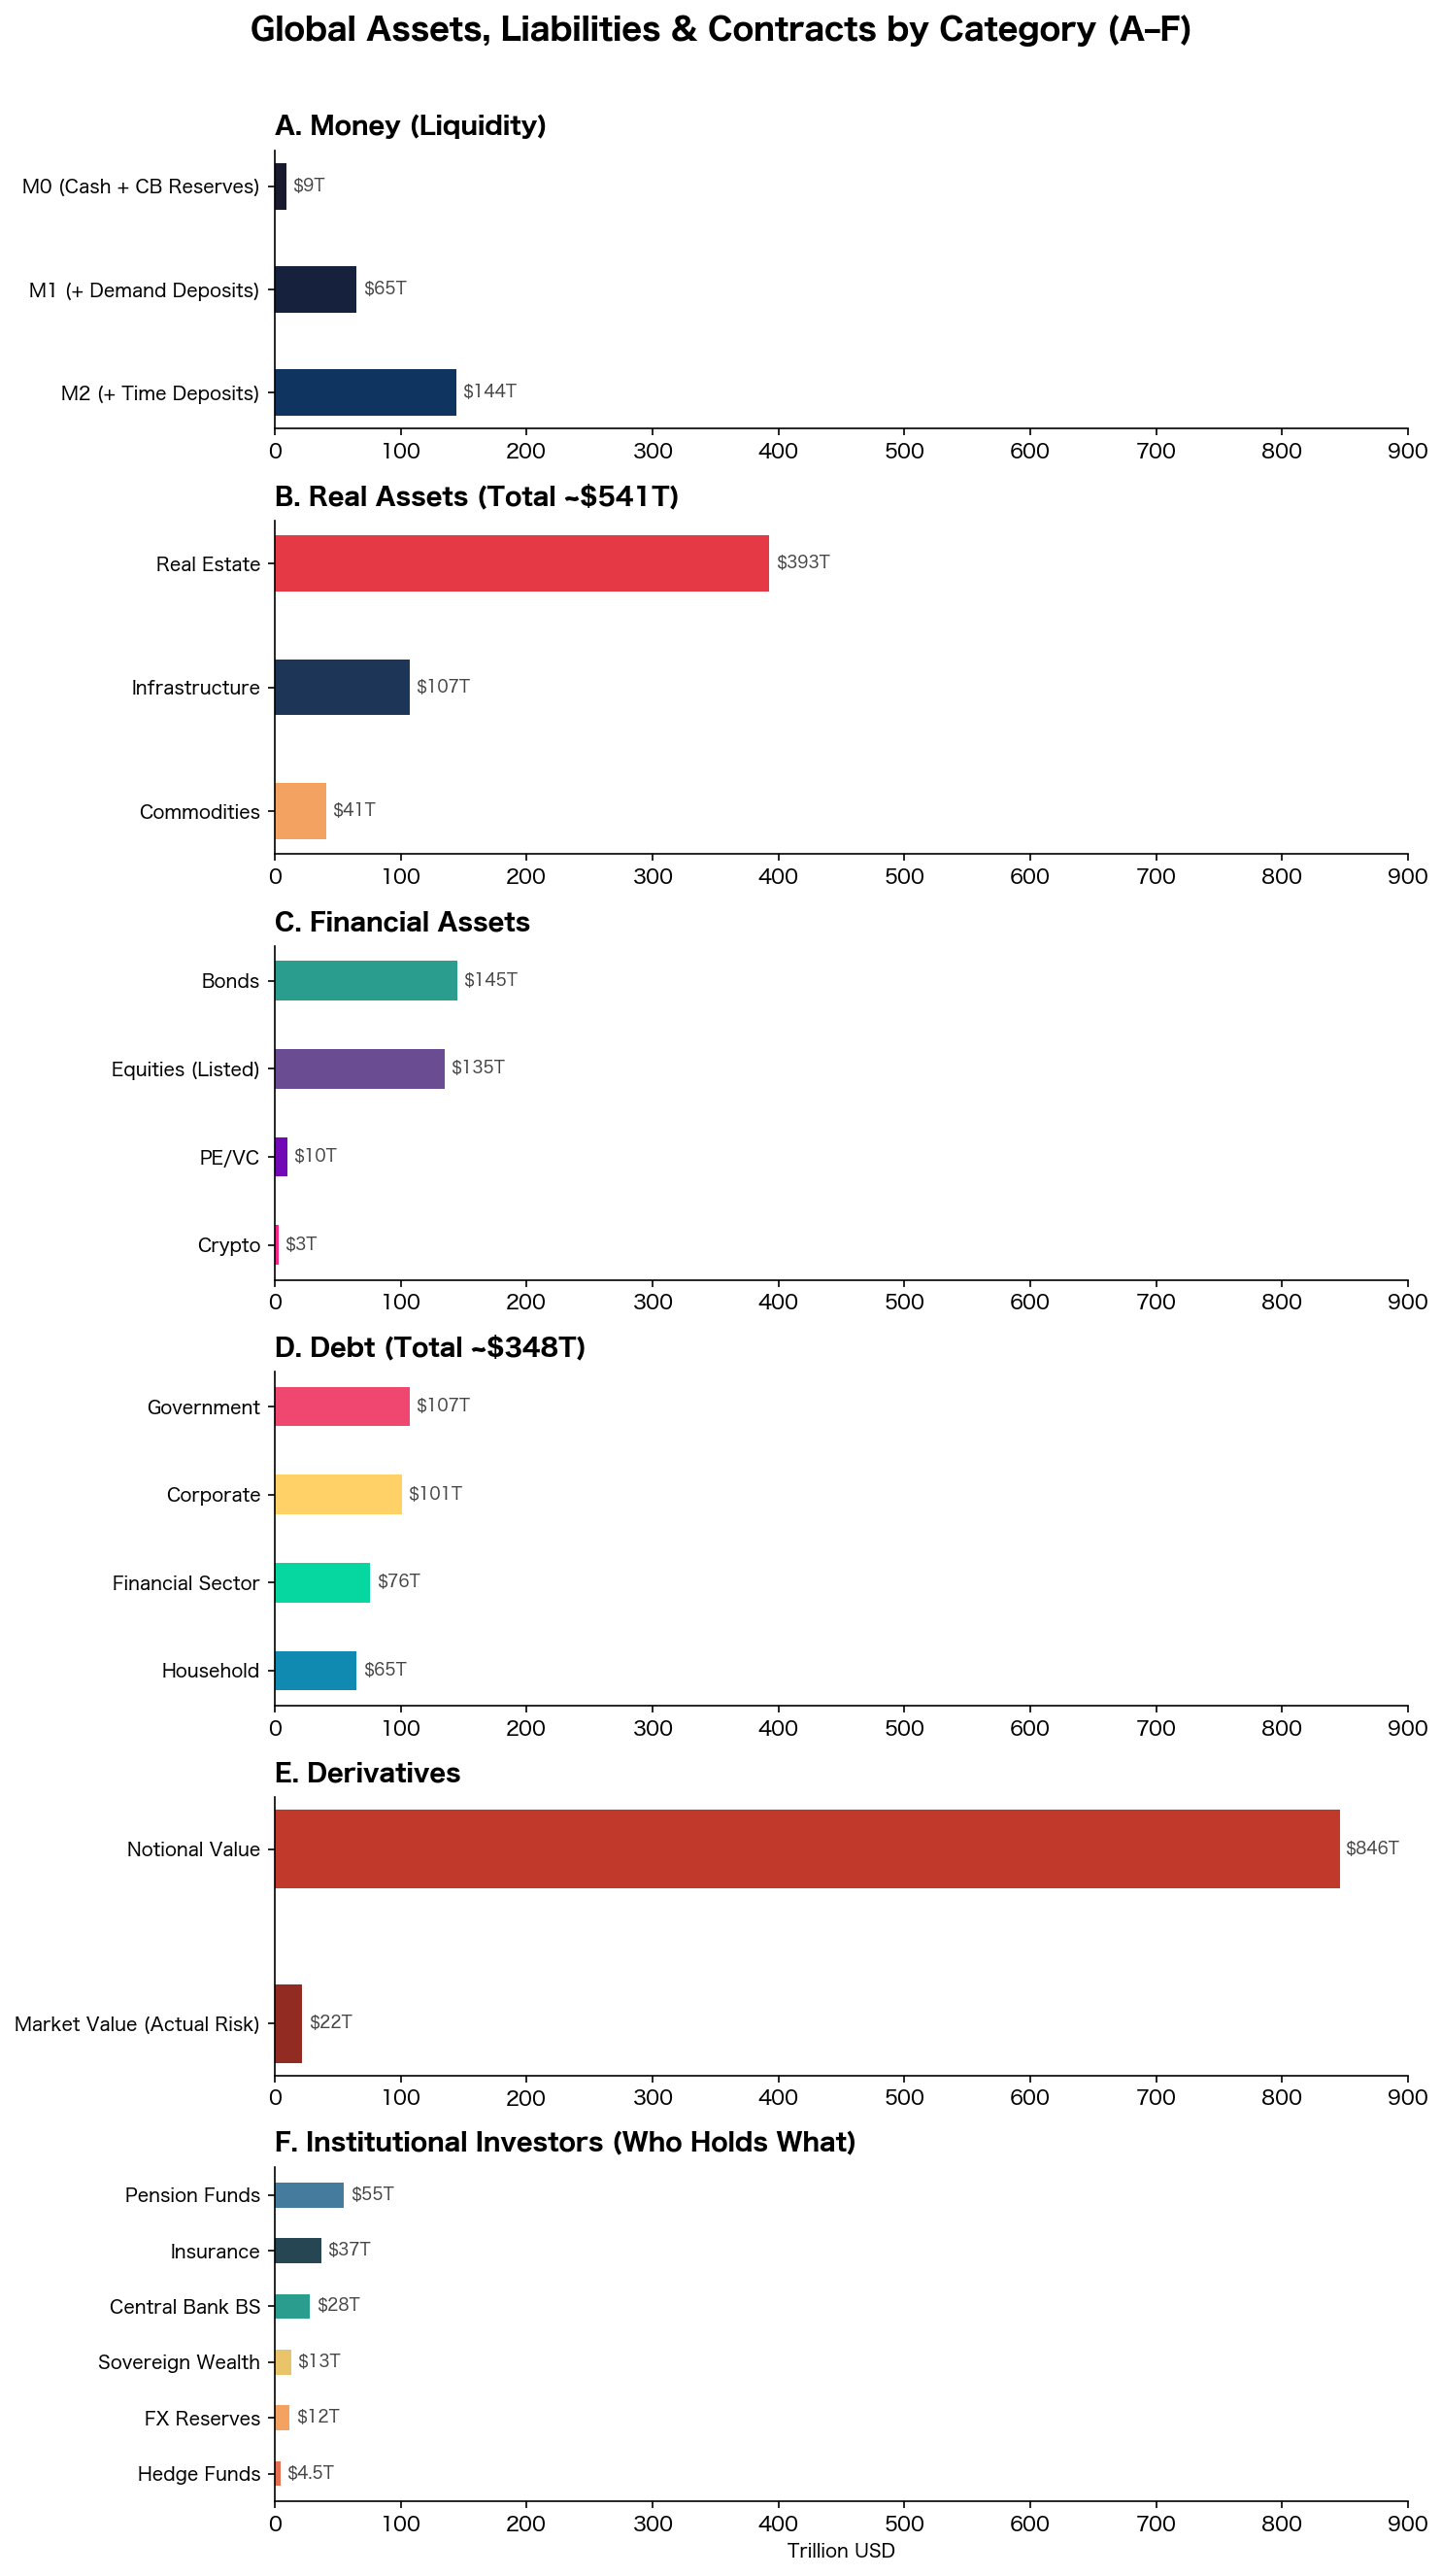
All Asset Classes at a Glance
The chart below lines up every category from Lenses A through F. The horizontal scale is uniform, so you can compare sizes across categories. Again, these are different measurements of the same economy — they cannot be added together.
Why Can ≈$144T of Money Support $600T+ in Assets?
Reason 1: Money Isn’t “Consumed” — It Circulates
You spend $1,000 to buy Apple stock. Your bank balance drops by $1,000 — but the seller’s bank balance rises by $1,000. M2 doesn’t change. The money didn’t “enter” the stock market; it simply changed owners within the banking system. The same dollar circulates over and over, putting a price tag on multiple assets along the way.
Reason 2: Prices Are Set by the Last Trade — So a Little Money Creates Enormous Valuations
If someone buys one share of Apple at $200, all approximately 15 billion shares are valued at $200, producing a ≈$3T market cap. But only $200 actually changed hands in that transaction.
In other words, an asset’s valuation has nothing to do with how much money was actually invested in it. A single trade sets the price for the entire asset class. Real estate works the same way — if the house next door sells for $500,000, your house is now “worth” $500,000 too, even though you haven’t sold it.
This mechanism is why total asset valuations ($600T+) can far exceed the money supply (≈$144T).
Reason 3: Credit (Debt) Amplifies Purchasing Power
Global debt stands at ≈$348T. This is a mechanism for spending money that doesn’t yet exist. When you take out a mortgage, you’re converting future income into present purchasing power.
The Feedback Loop
Central Bank ──creates M0──→ Banks ──create M2 via lending──→ Economic Agents
     ▲                                                          │
     │                                                          │ Use M2 to buy/sell assets
     │                                                          │ → Assets get priced
     │                                                          ▼
     │                                                      Assets ≈$700T+
     │                                                      Liabilities ≈$348T
     │                                                          │
     │      Adjusts M0 via                                      │ Asset prices UP → Collateral UP
     └───── interest rates & QE/QT ◄────────────────────────────┘ → More lending → M2 UP
                                                                  → Asset prices UP further
                                                                 (Financial Accelerator)
When this loop accelerates, you get a bubble. When it reverses, you get a financial crisis. The 2008 Global Financial Crisis was exactly this loop running in reverse: falling home prices → collateral impairment → credit contraction → further price declines.
Consistency Check: Where Does the $600T Come From?
The fundamental accounting equation:
Assets = Liabilities + Net Worth
Rearranged:
Net Worth = Assets − Liabilities
Global “assets” are the sum of real assets (Lens B) and financial assets (Lens C). “Liabilities” are Lens D. Substituting:
Net Worth = (Real Assets + Financial Assets) − Liabilities
Now let’s walk through every item from Lenses A–F and see where it falls in this equation.
Items That Cancel Out
Deposits (Lens A): Your $10,000 deposit is a financial asset to you and a $10,000 liability to the bank. The same amount appears on both sides, so it nets to zero. The entire ≈$144T of M2 washes out.
Bonds (part of Lens C ⇔ Lens D): Your $10,000 government bond is a financial asset to you and a $10,000 liability to the government. Corporate bonds and loans work the same way. The ≈$145T bond market largely cancels against the ≈$348T in total liabilities.
Derivatives (Lens E): Fully cancel out. Every derivative is a two-party contract — one side’s $1M gain is the other side’s $1M loss. Summed globally, wins and losses net to zero. The ≈$846T notional figure measures the scale of contracts, not assets or liabilities.
Items That Don’t Cancel Out
Real assets (Lens B): ≈$540T. Real estate, infrastructure, commodities. Physical things are nobody’s liability. This is the bulk of global net worth.
Equities (part of Lens C): Stocks are not liabilities, so they don’t cancel. However, stocks represent ownership of companies, and those companies’ factories and equipment are already counted in real assets (Lens B). The portion of equity value that overlaps with real assets would be double-counted.
So what part of equity value doesn’t overlap with real assets? Intangible assets — brands, patents, technology, customer bases. Most of Apple’s market cap comes from its brand and technology, not its factories. Of the ≈$130T in global public equities, the portion that doesn’t overlap with real assets — i.e., intangibles — is estimated at roughly ≈$60T.
Crypto (part of Lens C): ≈$3T. Nobody’s liability and not a physical asset. Small relative to the whole, but it counts toward net worth.
Items That Overlap
Institutional investors (Lens F): The ≈$55T in pension funds, ≈$37T in insurance companies, etc. are simply Lenses B and C viewed from the angle of “who holds what.” The stocks held by pension funds are the same stocks counted in Lens C. They’re not independent assets and don’t enter the calculation.
The Sum
Real assets (Lens B)                          ≈$540T
Intangible assets (equity value beyond B)      ≈$60T
Crypto (part of Lens C)                         ≈$3T
──────────────────────────────────────────────────────
Total                                         ≈$603T
This closely matches McKinsey’s ≈$600T figure. Note that the ≈$60T intangible estimate is not taken directly from McKinsey’s report — it’s back-calculated from the gap between $600T and real assets.
Putting It Into Practice: How to Act on This Structure
Scenario 1: Central Bank Rate Cycles — The Starting Point for Everything
Why it matters most: Interest rates are the “faucet” controlling the M0 → M2 → asset price feedback loop. Raise rates and the faucet tightens; cut rates and it opens.
What happens when rates rise:
- Higher borrowing costs → less corporate and consumer borrowing → fewer new loans → M2 growth slows
- Existing variable-rate loan payments increase → spending and investment decline
- Bond yields rise → existing bond prices fall (yields and prices move inversely)
- Equity valuations compress (higher discount rate on future cash flows)
- Real estate faces headwinds as mortgage rates climb → downward price pressure
What happens when rates fall: All of the above reverses.
Key indicators to watch:
- Central bank policy rates (Fed Funds Rate, BOJ policy rate, ECB main refinancing rate)
- Market-implied future rates (CME FedWatch Tool)
- M2 year-over-year growth rate
Action framework:
- Rate hikes begin → Rising rates push bond prices down and raise corporate borrowing costs, creating headwinds for stocks. Reduce long-duration bonds, growth stocks, and real estate exposure; increase short-duration bonds and cash
- Rate hikes pause → A pivot to cuts becomes likely. Bonds bought before rate cuts gain value (a bond paying 3% becomes a prized asset when new bonds only pay 1%), so start building long-duration positions
- Rate cuts begin → Lower borrowing costs stimulate the economy. Tailwind for equities, real estate, and gold. Holding cash means missing the rally — deploy capital into investments
Scenario 2: QE (Quantitative Easing) & QT (Quantitative Tightening) — Directly Manipulating M0
What is QE? The central bank buys government bonds and MBS from the market, paying with newly created money (M0). A last resort when rate cuts alone aren’t enough.
What QE does:
- Central bank balance sheet expands (≈$28T → even larger)
- M0 increases directly → bank reserves grow → lending capacity expands
- Bond buying pushes yields down → investors move into riskier assets (equities, corporate bonds, real estate) — the “risk-on” trade
- Broad-based asset price inflation
What QT does: The reverse. The central bank sells holdings or lets them mature → M0 shrinks → liquidity drains → downward pressure on asset prices.
Historical examples:
- March 2020: COVID crash → Fed launches unlimited QE → S&P 500 doubles from its low within two years
- June 2022: Fed begins QT → equities, crypto, and real estate all decline
Key indicators to watch:
- Fed balance sheet (FRED: WALCL) — updated weekly
- BOJ balance sheet — updated every 10 days
- ECB balance sheet — updated weekly
Action framework:
- QE begins → The most powerful buy signal. Strong tailwind for equities, gold, and crypto
- QT begins → Liquidity headwind. Reduce leverage, increase cash allocation
- The QE-to-QT transition → The most dangerous period. Likely near the peak of asset prices
Scenario 3: Inflation — When Money Loses Its Value
Mechanism: When M2 expands beyond the economy’s productive capacity, it takes more money to buy the same goods.
Asset class performance during rising inflation (historical tendencies):
| Asset | Performance | Reason |
|---|---|---|
| Gold | Strong ↑ | The classic inflation hedge. A real asset |
| Commodities | Strong ↑ | Real assets. Their prices are literally components of inflation |
| Real estate | Moderate ↑ | Real asset, but rising rates can create headwinds |
| Equities | Mixed | Companies with pricing power (energy, materials, staples) do well. Growth stocks suffer |
| Bonds | Strong ↓ | Fixed coupon payments lose real value. Inflation’s biggest victim |
| Cash | Worst ↓ | Purchasing power erodes directly |
Key indicators to watch:
- CPI (Consumer Price Index), PCE (Personal Consumption Expenditures deflator)
- Inflation expectations (US 10-year breakeven: FRED T10YIE)
- Commodity price indices (CRB Index)
Action framework:
- Signs of accelerating inflation → Reduce bond and cash allocations. Increase gold, commodities, and TIPS (Treasury Inflation-Protected Securities)
- Inflation peaks → Opportunity to buy long-duration bonds (falling rates = rising bond prices)
Scenario 4: Recession — The Loop in Reverse
Mechanism: Corporate earnings decline → layoffs → consumer spending drops → earnings decline further. Asset prices fall → collateral values impaired → credit tightens → M2 growth stalls → asset prices fall further.
Leading indicators (typically flash 12–18 months before a recession):
| Indicator | What to Watch | Threshold |
|---|---|---|
| Yield curve (10Y–2Y spread) | Inversion (goes negative) | Predicted 7 of the last 8 recessions |
| ISM Manufacturing PMI | Falls below 50 | Signals economic contraction |
| Initial jobless claims | Sharp increase | Early signal of labor market deterioration |
| Credit spreads (corporate–Treasury yield gap) | Rapid widening | Rising corporate credit risk |
| M2 year-over-year | Turns negative | Liquidity contraction (rare but powerful signal) |
Action framework:
- Leading indicators flash → Gradually reduce equity exposure. Increase long-duration Treasuries, gold, and cash
- Recession is confirmed → Anticipate central bank rate cuts and QE; begin gradually buying equities (“the darkest hour is the best time to buy”)
- Recovery phase → Cyclical stocks (financials, materials, industrials) tend to rebound first
Scenario 5: Currency Crisis — When ≈$12T in FX Reserves Come Under Pressure
Mechanism: An emerging-market currency plunges → USD-denominated debt becomes far more expensive to service → capital flight → further currency depreciation. The central bank burns through FX reserves to defend the currency, but once reserves run out, the currency collapses.
Historical examples: 1997 Asian Financial Crisis, 2018 Turkish lira crisis, 2022 Sri Lanka
Key indicators to watch:
- DXY (Dollar Index) — overall USD strength
- Changes in EM foreign exchange reserves
- EM CDS (credit default swap) spreads
Action framework:
- USD surging + EM currencies plunging → Avoid EM assets. Seek safety in USD-denominated assets and gold
- Crisis begins to stabilize → EM assets may be deeply discounted. Potential long-term buying opportunity
Summary
The world’s net worth is roughly $600 trillion. It consists primarily of real assets like real estate and infrastructure (≈$540T) plus intangible assets like corporate brands and technology (≈$60T).
Financial assets such as deposits, bonds, and loans always have a corresponding liability, so they cancel out at the global level. Derivatives work the same way. That’s why the $846T+ in notional derivatives and $348T+ in global debt don’t show up in net worth.
The force that moves this entire structure is central banks. They raise and lower interest rates and directly manipulate the money supply through quantitative easing and tightening. Watch what central banks are doing, and you can see where money is flowing, which assets are rising, and which are falling.
This article is based on publicly available data sources and is not investment advice. All investment decisions are your own responsibility.