The gasoline in the car you drove this morning. The plastic bottle on the convenience store shelf. The kerosene heater that warmed your room last winter.
Most of these are made from oil that traveled through a strait 8,000 km from the Middle East.
On February 28, 2026, the United States and Israel launched military operations against Iran. The Strait of Hormuz, connecting the Persian Gulf and the Gulf of Oman, is a chokepoint through which roughly one-fifth of the world’s seaborne oil trade passes. Iran is believed to have the capability to lay 2,000 to 6,000 naval mines in this strait.
So what happens to Japan if the Strait of Hormuz is blocked?
Many people assume the lights go out. The answer is no. Oil accounts for just 3% of Japan’s electricity generation. What actually stops is cars, logistics, plastics, and heating — in other words, society itself.
This article breaks down Japan’s energy structure through 8 charts and reveals where the real “Hormuz Strait risk” lies.
The Big Picture: Japan’s Energy at a Glance
To understand Japan’s energy, you need to distinguish two numbers: primary energy (raw fuel taken from nature) and electricity mix (what generates the electricity). Confusing the two leads to a fundamental misunderstanding of oil risk.
| Energy Source | Primary Energy (Input) → What It Becomes |
|---|---|
| Oil 34.8% | → Gasoline, diesel, naphtha, kerosene, heavy oil (barely used for power generation) |
| Coal 24.4% | → Power generation (baseload), steelmaking |
| Natural Gas (LNG) 20.8% | → Power generation (load-following), city gas |
| Renewables 12%* | → Power generation |
| Nuclear 8% | → Power generation |
*Renewables account for approximately 27% of the electricity mix (electricity only). In primary energy, oil consumed for transportation, naphtha, and other non-electric uses inflates the denominator, diluting the renewable share.
Oil is the single largest energy source at 35% of primary energy. Yet most of it never goes to power generation. It is refined into gasoline, diesel, naphtha, and kerosene — used for everything except electricity. This is the starting point for the entire discussion.
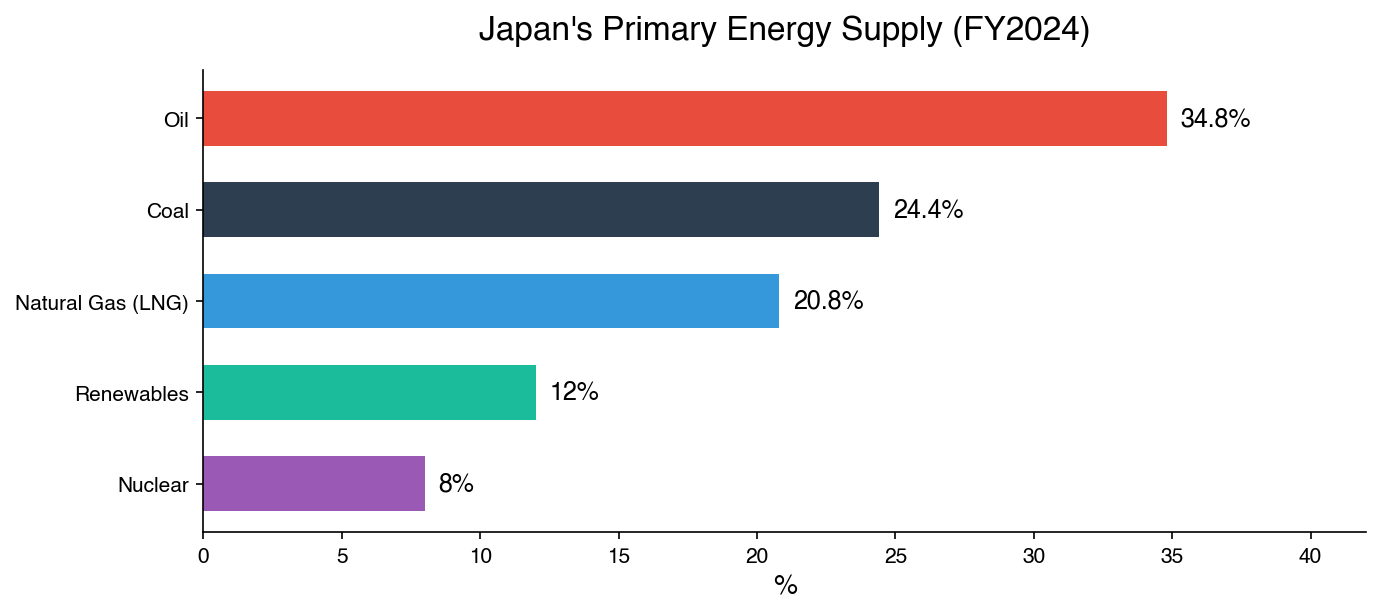
Source: Agency for Natural Resources and Energy, FY2024 preliminary (nippon.com)
Angle 1: What Generates Japan’s Electricity — Oil Is Barely in the Picture
Japan’s average electricity demand is approximately 100 GW (annual generation of 900-1,000 TWh). Looking at the electricity mix, oil’s presence is negligible.
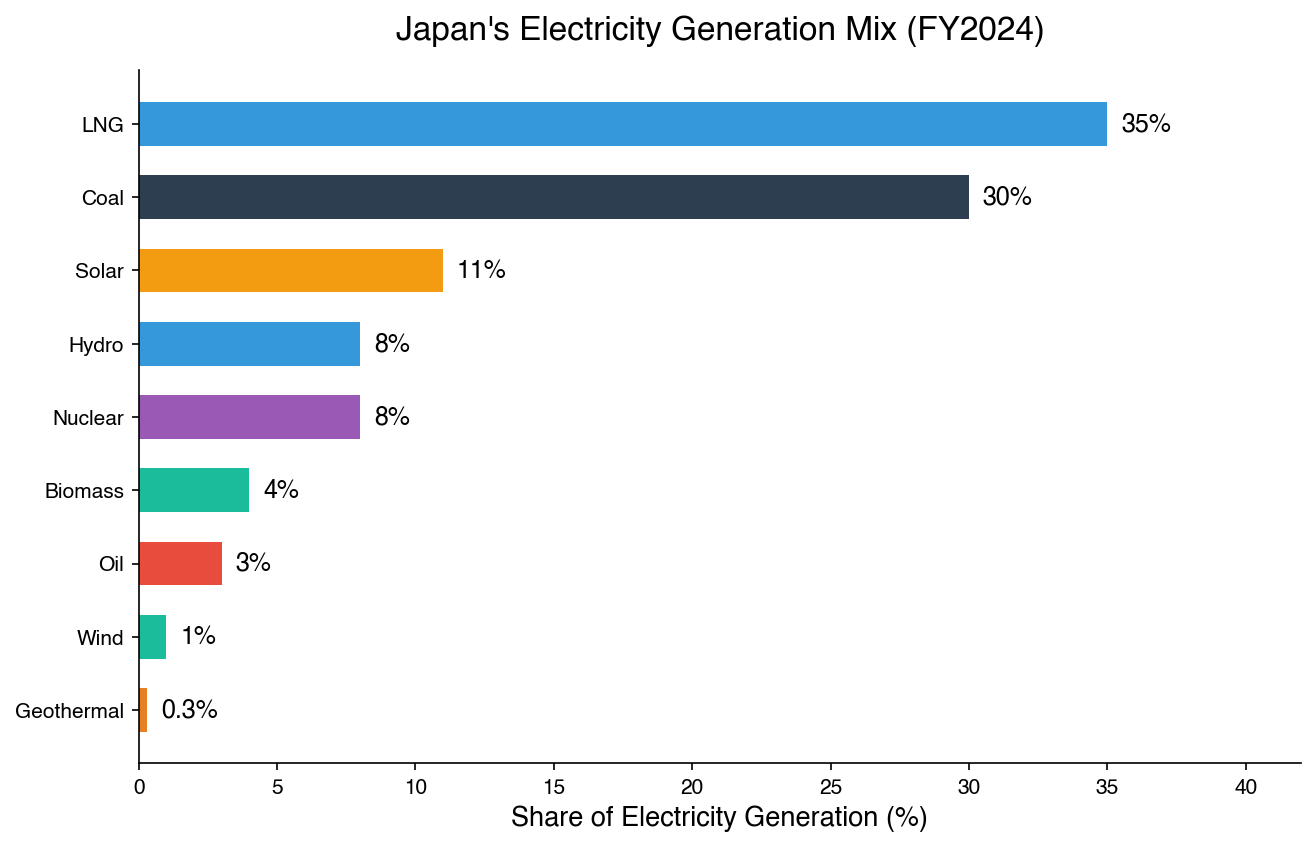
LNG (natural gas) at 35% and coal at 30%. These two alone account for 65% of power generation. Oil is just 3%, used only for remote island power plants and emergency backup.
Why is LNG the backbone of power generation? Three reasons:
- Fast ramp-up. Gas turbines can start in minutes and flexibly respond to demand fluctuations. Coal plants take hours to half a day to start
- High efficiency. Combined-cycle plants (gas turbine + waste heat steam turbine) achieve 60-63% thermal efficiency, far exceeding coal’s 40-45% and oil’s 35-40%
- Lower CO2 emissions. CO2 per kWh is roughly half that of coal (470 g/kWh vs. 940 g/kWh)
Coal is “cheap but slow,” running 24/7 as baseload. LNG is “expensive but fast,” filling morning/evening peaks and smoothing renewable variability. This combination is the foundation of Japan’s power system.
In short, even if the Strait of Hormuz is blocked, the direct impact on Japan’s electricity supply is limited. The main fuel for power generation, LNG, comes from Australia (41%) and Malaysia (16%), with Middle East dependency at only approximately 11%. Coal’s Middle East dependency is virtually zero.
Source: EIA - Japan Country Analysis, METI - FY2023 Energy Supply and Demand Report
Angle 2: What Oil Is Actually Used For — Not Power, but Social Infrastructure
So what is Japan doing with the approximately 175 million kL (approximately 3 million barrels/day) of oil it consumes each year?
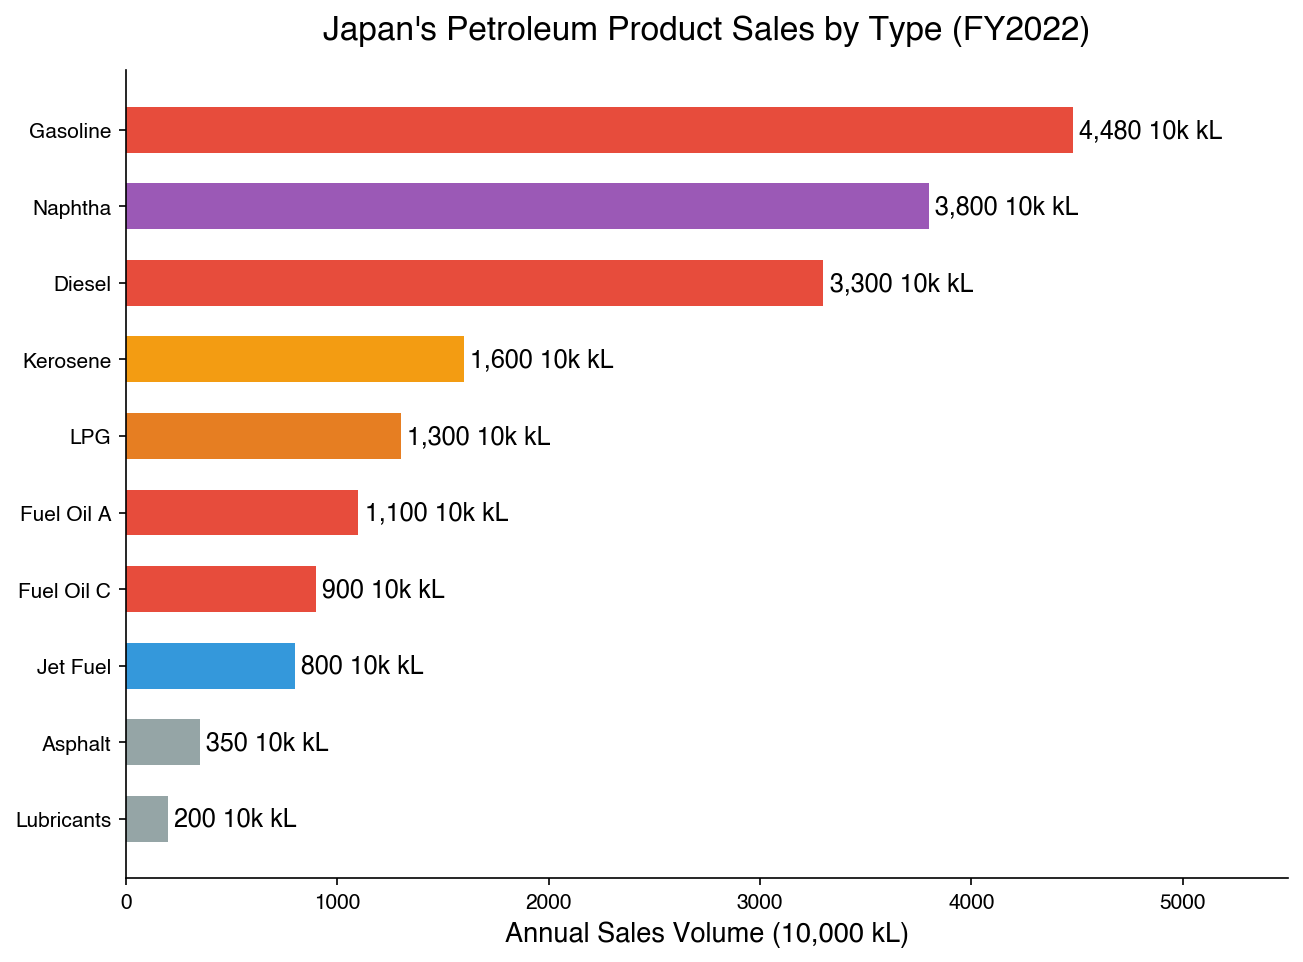
Gasoline leads (44.8 million kL), followed by naphtha (38 million kL) and diesel (33 million kL). Aggregating by sector reveals oil’s true role.
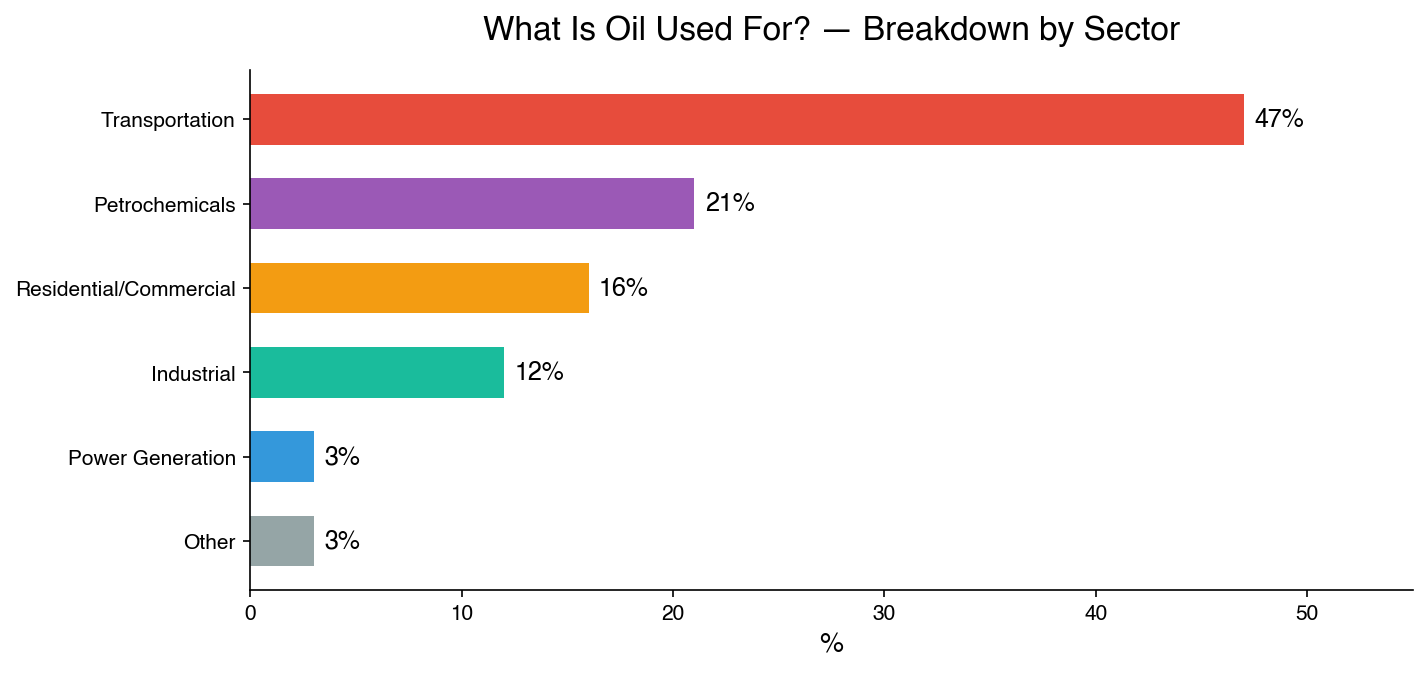
| Sector | Share | What Stops If Supply Is Cut |
|---|---|---|
| Transportation | 47% | Gas stations run dry. Logistics halt. Supermarket shelves go empty |
| Petrochemicals | 21% | Plastics, synthetic fibers, and medical supplies become impossible to manufacture |
| Residential/Commercial | 16% | Heating crisis in northern Japan. Cooking and hot water cut off in rural areas |
| Industrial | 12% | Factory boilers shut down. Fishing operations cease |
| Power Generation | 3% | Remote islands and emergency only. Limited impact |
| Other | 3% | Road paving and machine lubricant shortages |
Power generation is just 3%. Even if Japan replaced 100% of its electricity with renewables and nuclear, the remaining 97% (approximately 170 million kL/year) of oil demand would remain untouched.
Transportation (47%) — The Largest Consumer
Gasoline for approximately 62 million passenger cars across Japan, diesel for trucks delivering goods to convenience stores, jet fuel for every flight out of Narita and Haneda. If oil stops, neither people nor goods move.
Petrochemicals (21%) — The Invisible Dependency
Extract naphtha from crude oil, crack it chemically, and you get PET bottles (PET resin), plastic bags (polyethylene), smartphone cases (polycarbonate), fleece jackets (polyester), car bumpers (polypropylene), and medical gloves, syringes, and IV bags. Look around you right now — it is harder to find something not made of plastic or synthetic fiber. All of it comes from oil.
Source: Statista - Japan petroleum products sales
Residential/Commercial (16%) — The Winter Lifeline
Kerosene heaters are a lifeline in Hokkaido, Tohoku, and Hokuriku during winter. Electric heating alone cannot meet cold-region demand. LPG (propane gas) is used for cooking and hot water in areas without city gas pipelines — approximately 40% of Japanese households depend on it.
Oil is not just burned for energy — it is the raw material for physical goods. That is why a Hormuz blockade does not cause blackouts; it shuts down society as a whole.
Angle 3: Middle East Dependency Is an Oil-Only Problem
80% of Japan’s energy comes from fossil fuels (oil + coal + LNG). But from a Hormuz risk perspective, the three are in completely different situations.
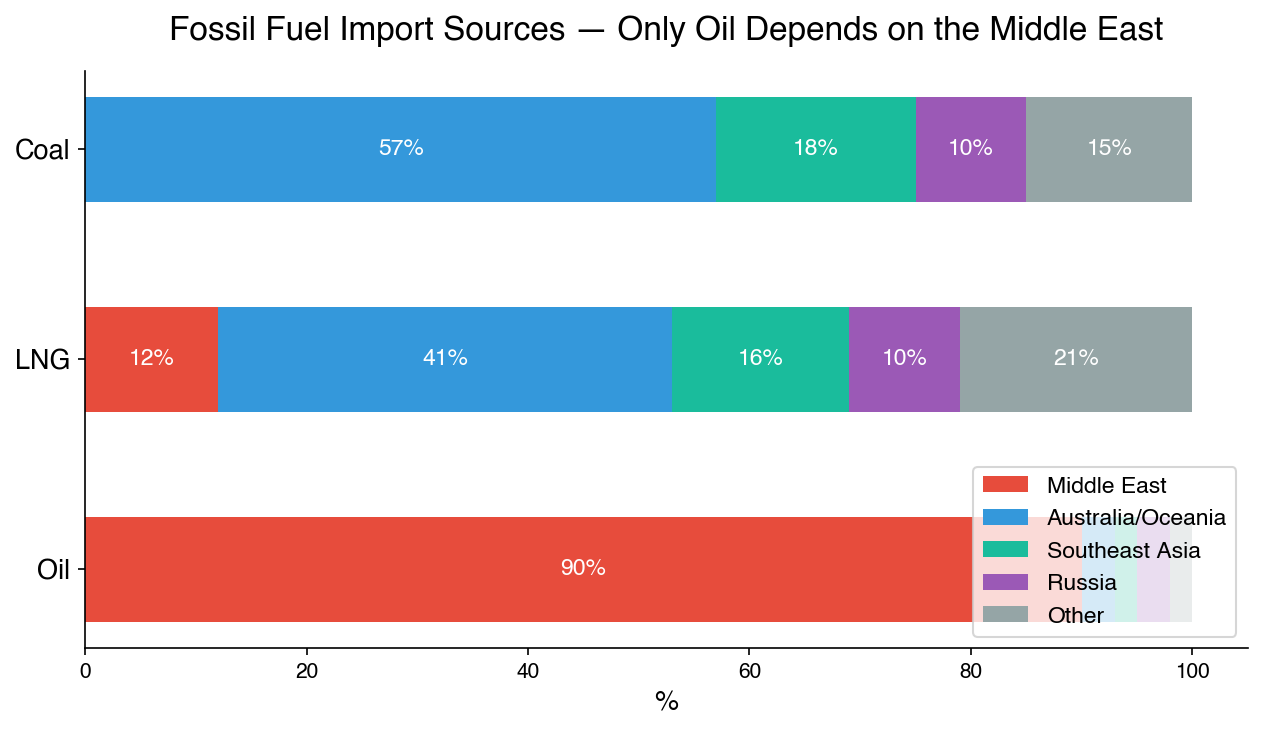
| Oil | LNG | Coal | |
|---|---|---|---|
| Middle East dependency | Approximately 95% | Approximately 11% | Nearly zero |
| Main suppliers | Saudi Arabia, UAE (concentrated) | Australia 41%, Malaysia 16% | Australia, Indonesia |
| Hormuz Strait risk | Extremely high | Low | Nearly none |
| Stockpiling | Tank storage (approximately 250 days) | Cryogenic tanks required (expensive) | Open-air storage (cheap) |
Only oil suffers from single-region concentration in the Middle East. LNG sources are diversified — Australia at 40%, Southeast Asia at 20% — with a small share transiting Hormuz (Middle East LNG imports are approximately 11%, of which approximately 6% passes through Hormuz). Coal imports from the Middle East are virtually zero.
This is why “oil” is the focal point when Iran tensions rise. Not LNG. Not coal.
LNG — The Power Generation Workhorse, Diversified Supply
LNG (liquefied natural gas) is natural gas cooled to -162°C. Japan imports approximately 64.9 million tons annually — 63% for power generation, 29% for city gas (residential/commercial), and 8% for industrial use.
Top FY2023 suppliers: Australia (26.6 million tons, 41%), Malaysia (10.2 million tons, 16%), Russia/Sakhalin-2 (6.3 million tons, 10%). In February 2026, JERA signed a 27-year contract with QatarEnergy, and the US share is projected to reach 30% by the 2030s, further diversifying supply.
Source: nippon.com - Japan’s LNG Suppliers, Reuters - QatarEnergy/JERA LNG deal
Coal — Cheap and Stable, but Dirty
Japan consumes approximately 170 million tons of coal annually — 65% for power generation and 25% for steelmaking. In steelmaking, coke (baked coal) is essential for the chemical reduction of iron ore; steel cannot currently be made without coal. Suppliers are centered on Australia and Indonesia, with virtually no Hormuz risk.
Angle 4: Can Renewables Save the Day? — The G7’s Lowest Level
“Can’t Japan just expand renewables to break free from oil dependency?” A fair question. But two structural problems stand in the way.
Problem 1: Japan’s Renewable Share Is Still Low
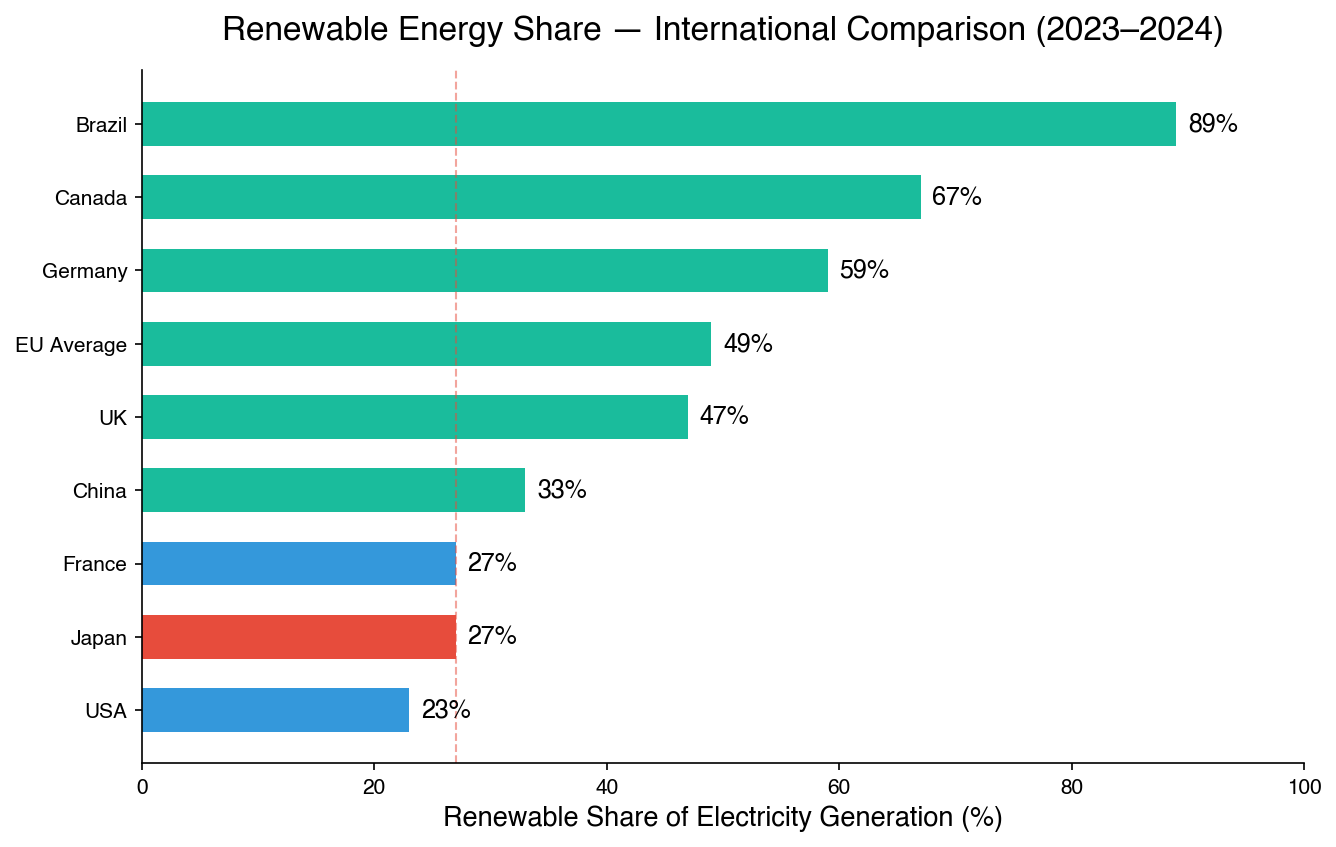
Japan’s renewable share is approximately 27% — the lowest level in the G7. Germany (59%) and the UK (47%) are far ahead.
The breakdown reveals the weakness. Solar has grown to 11%, but wind is just 1%. The biggest driver of renewable growth in Germany and the UK was offshore wind, but Japan has limited shallow waters, faces typhoon risk, struggles with fishing rights negotiations, and lacks sufficient transmission lines from Hokkaido/Tohoku to Tokyo/Osaka. Geothermal is just 0.3% despite Japan being a volcanic country — opposition from hot spring resorts and national park development restrictions are the barriers.
Problem 2: Renewables Can Only Replace “Power Generation”
This is the more fundamental issue. Renewables can generate electricity, but they cannot directly replace oil’s largest uses — transportation (47%) and petrochemical feedstock (21%).
Replacing gasoline cars with EVs can electrify part of transportation. But electrifying trucks, ships, and aircraft remains technologically distant. As for the chemical process of making plastics from naphtha — electricity simply cannot substitute.
Expanding renewables is important, but it alone does not solve the Middle East oil dependency risk. This is the structural dilemma of Japan’s energy security.
Source: Chambers - Renewable Energy 2025 Japan, Enerdata - Renewables in Electricity Production
Angle 5: A Bird’s-Eye View of Energy Flows
Mapping how primary energy is ultimately converted into end uses reveals the full picture of Japan’s energy structure.
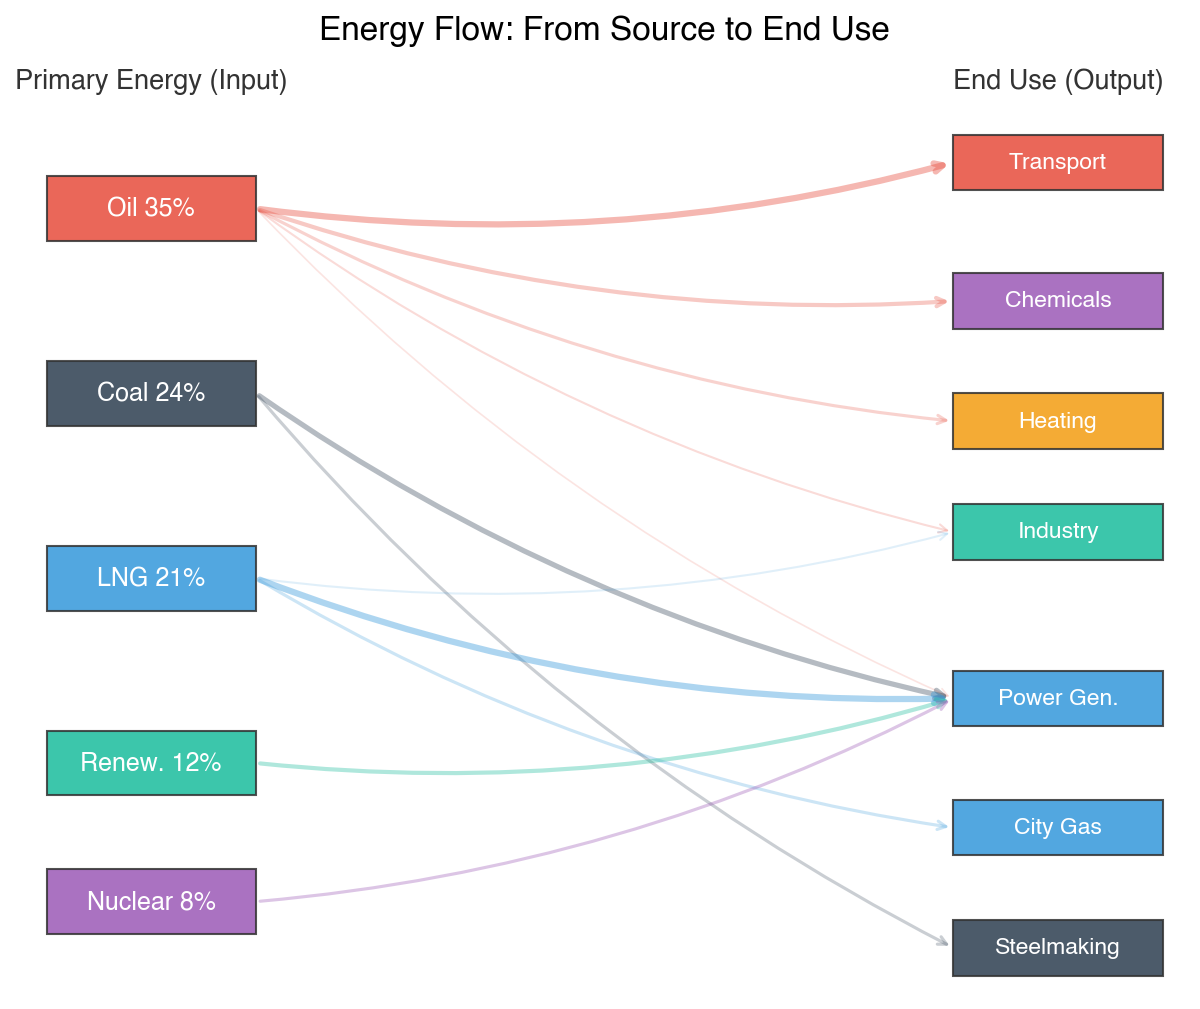
Key takeaways from this diagram:
- Oil feeds five different outputs. Transportation, chemicals, heating, industry, and power generation. Its uses are too broad for easy substitution
- Coal and LNG are concentrated in “power generation.” This makes them easier to replace with renewables and nuclear
- Power generation has five inputs. LNG, coal, renewables, nuclear, and oil (minimal). Diversification is progressing
- Transportation and chemical feedstock have only one input: oil. This is the greatest vulnerability
Angle 6: A Hormuz Blockade — What Is at Risk, and How Much?
Integrating the analysis so far, here is a sector-by-sector risk map for a Hormuz Strait blockade.
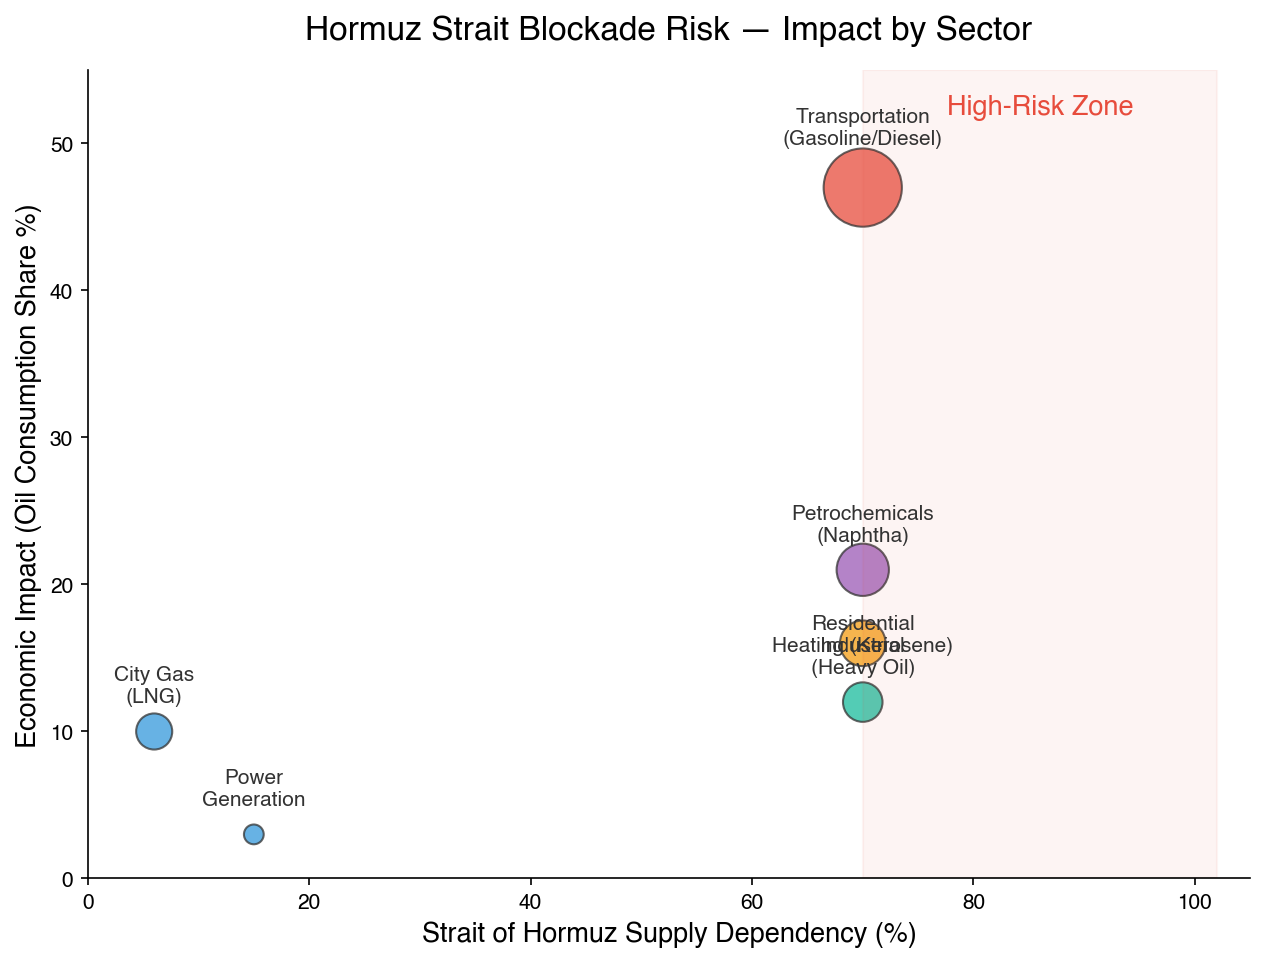
The horizontal axis shows supply dependency via the Strait of Hormuz; the vertical axis shows economic impact (oil consumption share). The further to the upper right, the greater the impact of a blockade.
- Transportation (upper right, largest bubble): Hormuz dependency approximately 70%, economic weight 47%. The most severe
- Petrochemicals (upper right): Hormuz dependency approximately 70%, economic weight 21%. Plastics and medical supplies halt
- Residential heating (right): Hormuz dependency approximately 70%, economic weight 16%. Life-threatening in northern Japan during winter
- Power generation and city gas (lower left): Low Hormuz dependency. LNG and coal are sourced outside the Middle East
Note: Japan’s Middle East oil dependency is approximately 95%, but only approximately 70% actually transits the Strait of Hormuz. Saudi Arabia has the capacity to export via Yanbu port on the Red Sea coast, bypassing Hormuz entirely.
“A Hormuz blockade means blackouts” is a misconception. The real risk is gas stations running dry, logistics grinding to a halt, plastics becoming impossible to manufacture, and heating failing in winter. Not electricity — social infrastructure.
Angle 7: Are Alternative Routes Enough?
If the Strait of Hormuz is blocked, two alternative export routes exist.
Saudi Arabia — East-West Pipeline (Petroline)
Transports crude oil from eastern oil fields to Yanbu port on the Red Sea coast. Capacity: approximately 5 million barrels/day. Can ship without passing through the Strait of Hormuz.
UAE — Abu Dhabi Crude Oil Pipeline
Transports crude oil from inland Abu Dhabi to Fujairah port on the Gulf of Oman. Capacity is more limited than Yanbu, but it is one of the few routes that bypass Hormuz.
| Yanbu (Saudi Arabia) | Fujairah (UAE) | |
|---|---|---|
| Hormuz bypass | Yes | Yes |
| Capacity | Approximately 5M bbl/day | Limited |
| Contract flexibility | Low (bound by long-term contracts) | High (spot market flexibility) |
| Commercial orientation | Low (state-driven) | High (market-driven) |
Is It Enough?
Japan imports approximately 2.5 million barrels/day. Yanbu’s 5 million bbl/day alone looks sufficient. But Japan would not be the only country using this route. China, South Korea, and Taiwan would all simultaneously try to bypass Hormuz. If all major East Asian importers rush to alternative routes at once, capacity falls far short.
Furthermore, if the Fujairah export terminal were attacked, one of the few Hormuz bypass routes would become unusable. Given the deepening UAE-Israel relationship since the 2020 Abraham Accords, the risk of Iran targeting Fujairah cannot be dismissed.
What Should Be Done — Prescriptions for Structural Risk
Short-term (Crisis Response)
- Strategic petroleum reserves: Japan holds 146 days of national reserves + 101 days of private reserves + 7 days of joint producer-nation reserves, totaling approximately 250 days. Short-term supply disruptions can be managed
- Expand spot procurement: Flexible spot purchases via Fujairah, unconstrained by long-term contracts
- East Asian coordination: Coordinate alternative route usage with China, South Korea, and Taiwan. Cooperation, not competition
Medium-term (Supply Diversification)
- Expand US LNG procurement: JERA plans to raise the US share to 30% by the 2030s. LNG de-Middle-Easternization is already underway
- Deepen Saudi/UAE relations: Secure access to alternative export routes (Yanbu/Fujairah). Strengthen energy dialogue
- Leverage the US-Japan alliance: Maritime security cooperation for the Strait of Hormuz, confirmed during PM Takaichi’s US visit
Long-term (Structural Transformation)
- Electrify transportation: Reduce the largest oil consumption sector (47%) through EV adoption. However, electrifying trucks, ships, and aircraft remains technologically distant
- Hydrogen and ammonia: Substitute petrochemical feedstock; reduce coal dependency through hydrogen-based steelmaking. Saudi/UAE hydrogen cooperation is underway
- Expand renewables: Full-scale offshore wind deployment (10 GW by 2030, 45 GW by 2040 targets). But renewables alone do not solve the oil risk
- Maximize nuclear: The 7th Strategic Energy Plan targets a 20% nuclear share (2040). Restart existing reactors and develop next-generation designs
Conclusion
80% of Japan’s energy comes from fossil fuels. But the Hormuz Strait risk directly hits only oil (35%). LNG (21%) and coal (24%) have diversified supply sources, limiting the impact.
The real risk of oil is not “blackouts.” Oil accounts for just 3% of power generation. The real risk is that transportation (47%), petrochemicals (21%), heating (16%), and industry (12%) — social infrastructure beyond electricity — all grind to a halt.
Expanding renewables is important, but it alone does not solve the oil risk. Renewables can only substitute the power generation portion; gasoline, naphtha, and kerosene cannot be replaced by electricity.
What Japan needs is a layered energy security strategy combining short-term reserve utilization, medium-term supply diversification, and long-term structural transformation. And above all, correcting the misconception that “oil = electricity” and accurately understanding where and how deeply oil permeates society is the starting point for every discussion.
This article is based on publicly available data sources. It is not investment advice.